
The Dashboard is the first screen you see when you open weDocs. It gives you a quick overview of your documentation, so you can check how much content you have, what people are reading, and which articles are actually helping them.
You will find it under weDocs–> Dashboard in your WordPress admin.
The free version shows your core stats and content activity. The Pro version adds a deeper analytics section along with contributor and tag insights.
In this guide, you will learn what every field on the dashboard means in both versions.
Note: Both dashboards share the same top stat cards and content panels. Everything described in the free section also appears in Pro, so read that first, then check the Pro section for the extra panels you unlock.
Free Dashboard
The free dashboard gives you an at a glance view of your documentation and how it is performing-
Stat Cards
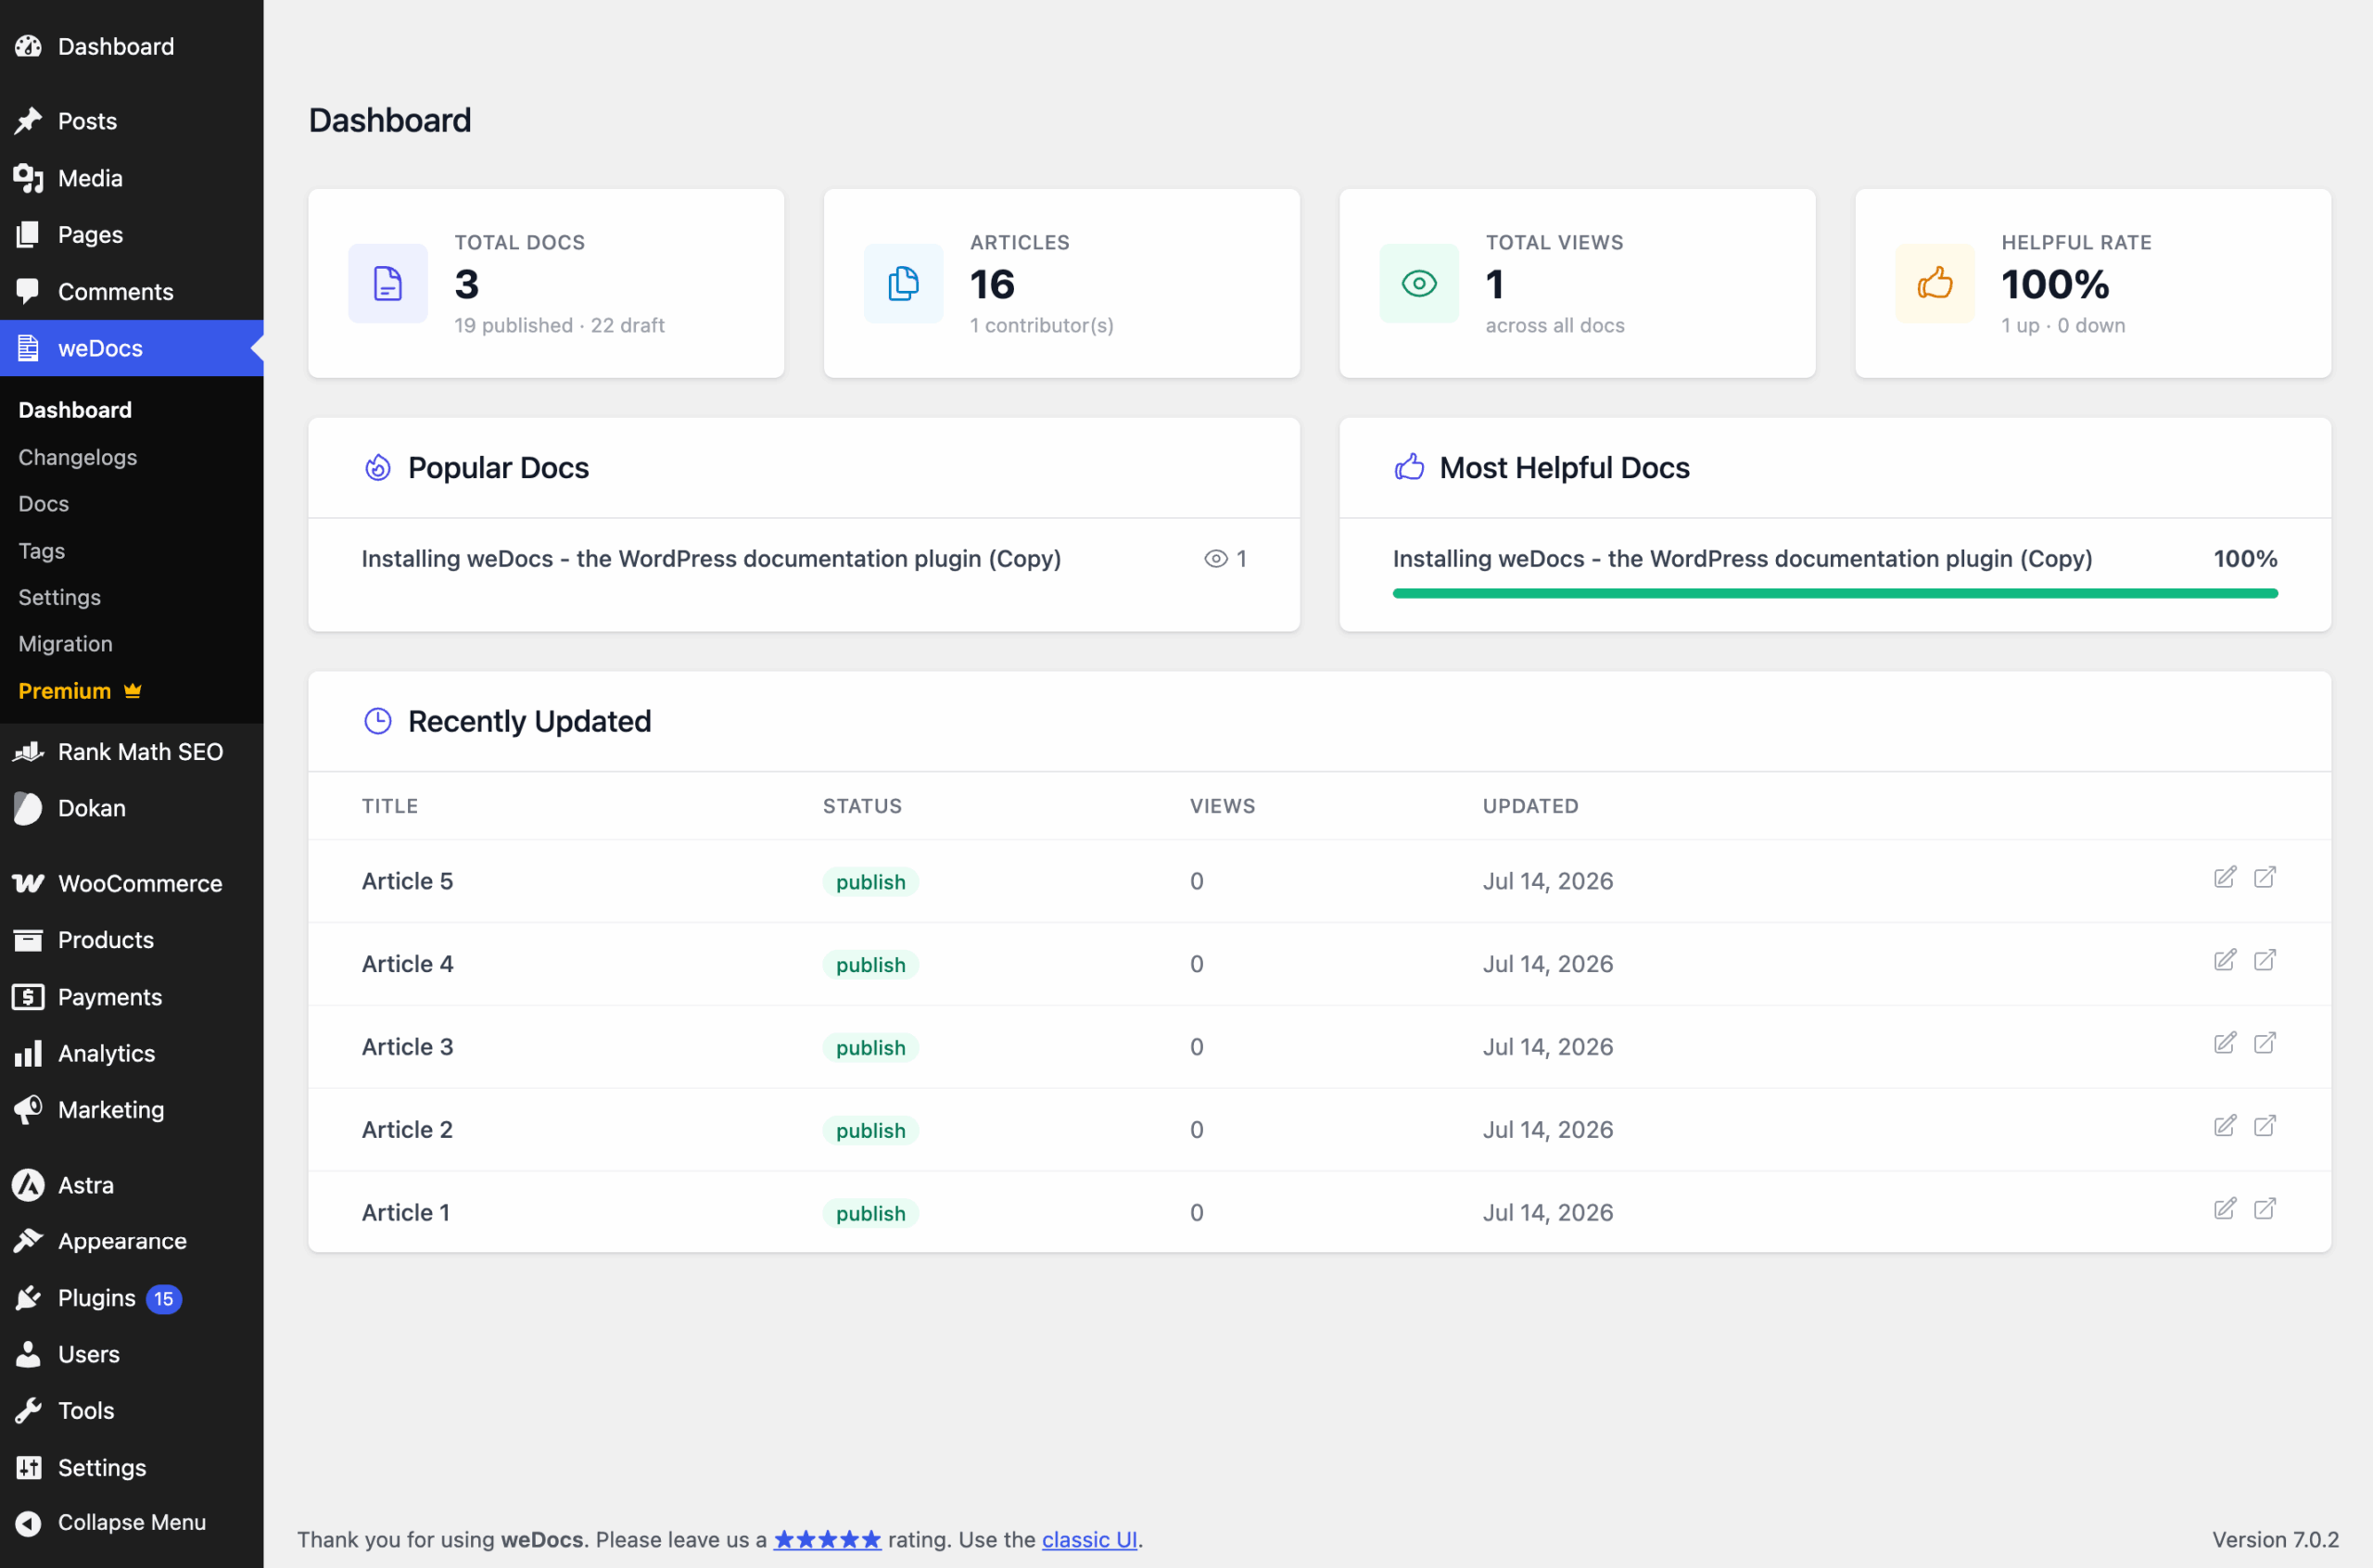
Four cards sit across the top of the screen.
Total Docs shows how many documentation sets you have created. Underneath, you get a breakdown of how many items are published and how many are still in draft, so you can see at a glance how much unfinished content is waiting.
Articles shows the total number of articles across all of your docs, with the number of contributors who have worked on them listed below.
Total Views shows how many times your documentation has been viewed across all docs. This is your simplest measure of whether people are finding your content.
Helpful Rate shows the percentage of readers who marked your documentation as helpful, along with the raw up and down counts. This tells you whether the content is actually solving problems, not just getting opened.
Popular Docs
This panel lists your most viewed documentation, with the view count shown beside each title. Use it to see which topics your readers care about most, and which ones are worth expanding.
Most Helpful Docs
This panel lists the documentation with the highest helpful rating, shown as a percentage with a progress bar. A doc with plenty of views but a low helpful rate is usually the first one worth rewriting.
Recently Updated
A table of your most recently edited content, so you always know what changed last. It shows four columns.
- Title is the name of the article.
- Status shows whether it is published or still a draft.
- Views shows how many times that article has been viewed.
- Updated shows the date it was last edited.
On the right of each row, you get two quick action icons. One opens the article in the editor, and the other opens it on your live site-
[Screenshot: Recently Updated table with action icons]
Note: In the free version, you will see a Premium link in the weDocs menu. This is where you can upgrade to unlock the Pro dashboard panels described below.
Pro Dashboard
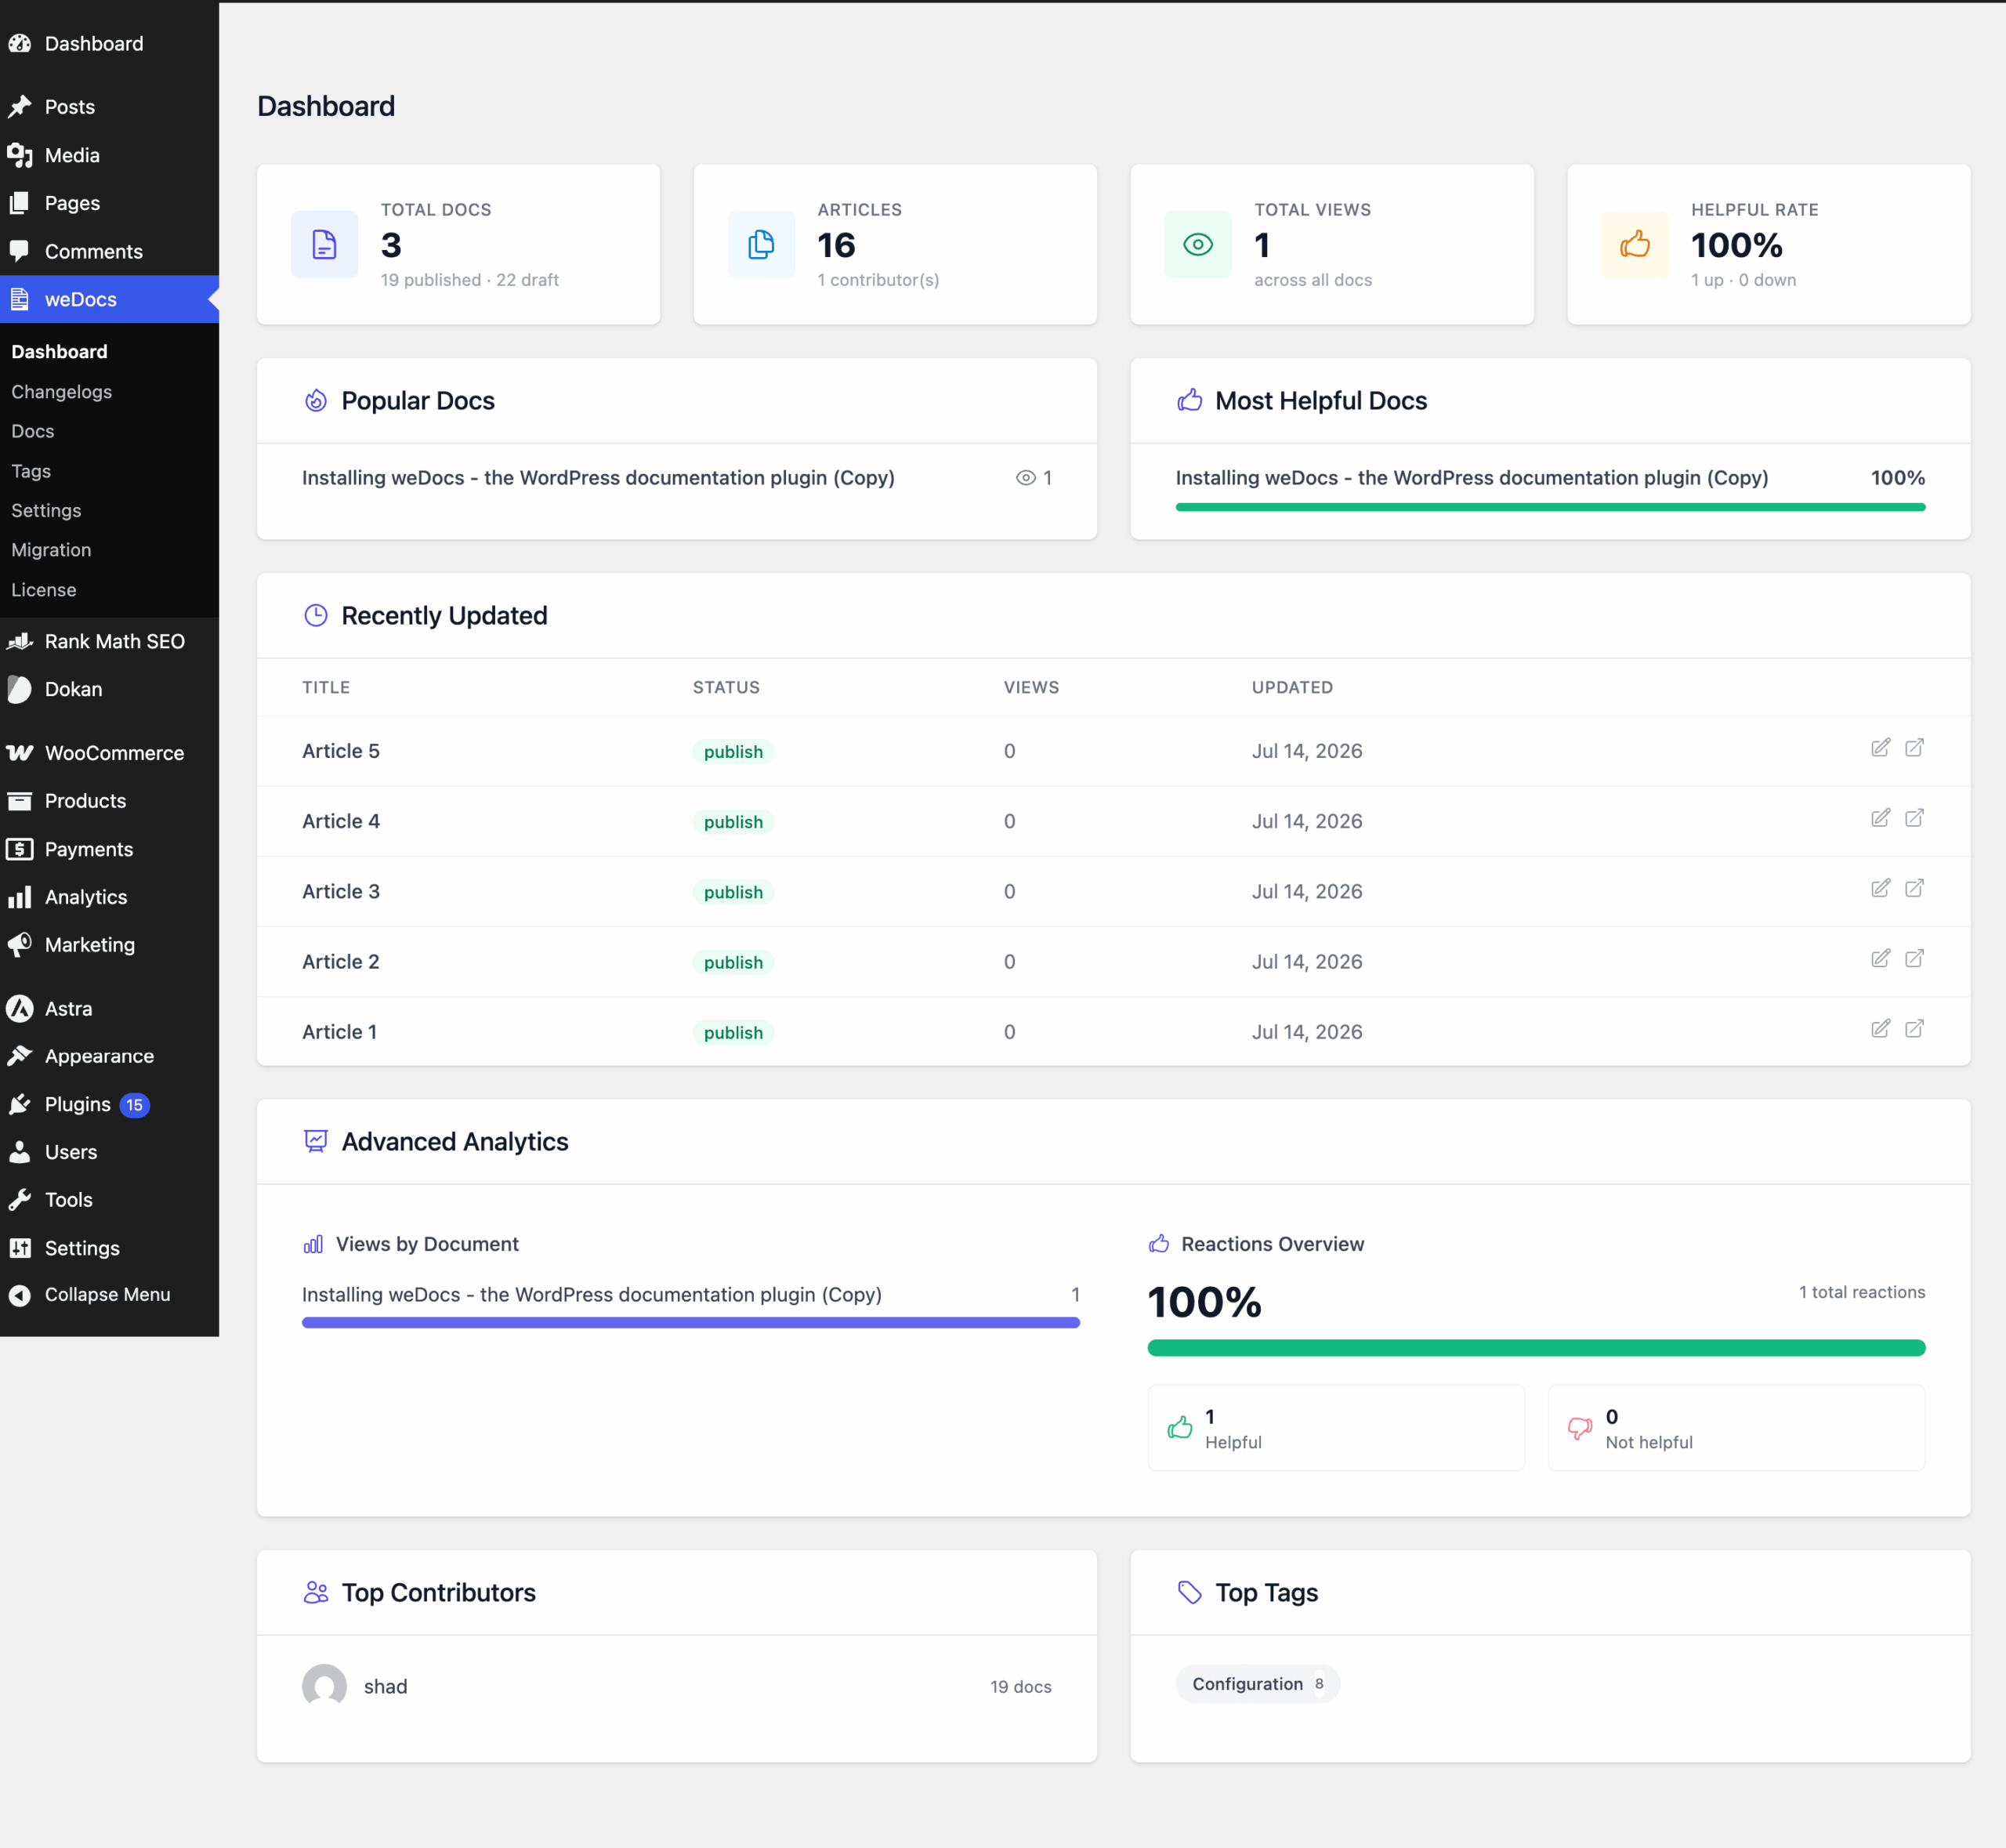
The Pro dashboard keeps everything from the free version and adds three more panels underneath, giving you a much clearer picture of how your documentation is performing-
Advanced Analytics
This section is split into two parts.
Views by Document shows a visual breakdown of views per document, with a bar for each one and the exact count beside it. Instead of a single total, you can see exactly which documents are pulling the traffic.
Reactions Overview shows your overall helpful percentage along with the total number of reactions received. Below that, two boxes split the count into Helpful and Not helpful reactions, so you can see the raw feedback behind the percentage-
[Screenshot: Advanced Analytics panel]
Top Contributors
This panel shows who is writing your documentation. Each contributor appears with their avatar, name, and the number of docs they have worked on.
This is useful for teams, since you can see at a glance who is carrying the documentation workload and who might need support-
[Screenshot: Top Contributors panel]
Top Tags
This panel shows your most used tags, each displayed as a chip with the number of articles assigned to it. It gives you a quick sense of which topics dominate your knowledge base, and where you may have gaps worth filling-
[Screenshot: Top Tags panel]
Note: In the Pro version, the Premium link in the weDocs menu is replaced by a License page, where you can manage your license key.
This is how you can read and use the weDocs dashboard to keep track of your documentation.